Create an Effective Analytics Dashboard
Create an Effective Analytics Dashboard
Wednesday, January 31, 2024
Have you ever wondered how an analytics dashboard goes beyond being just a collection of charts and graphs?
What if an analytics dashboard could be a powerful tool for informed decision-making rather than just displaying metrics?
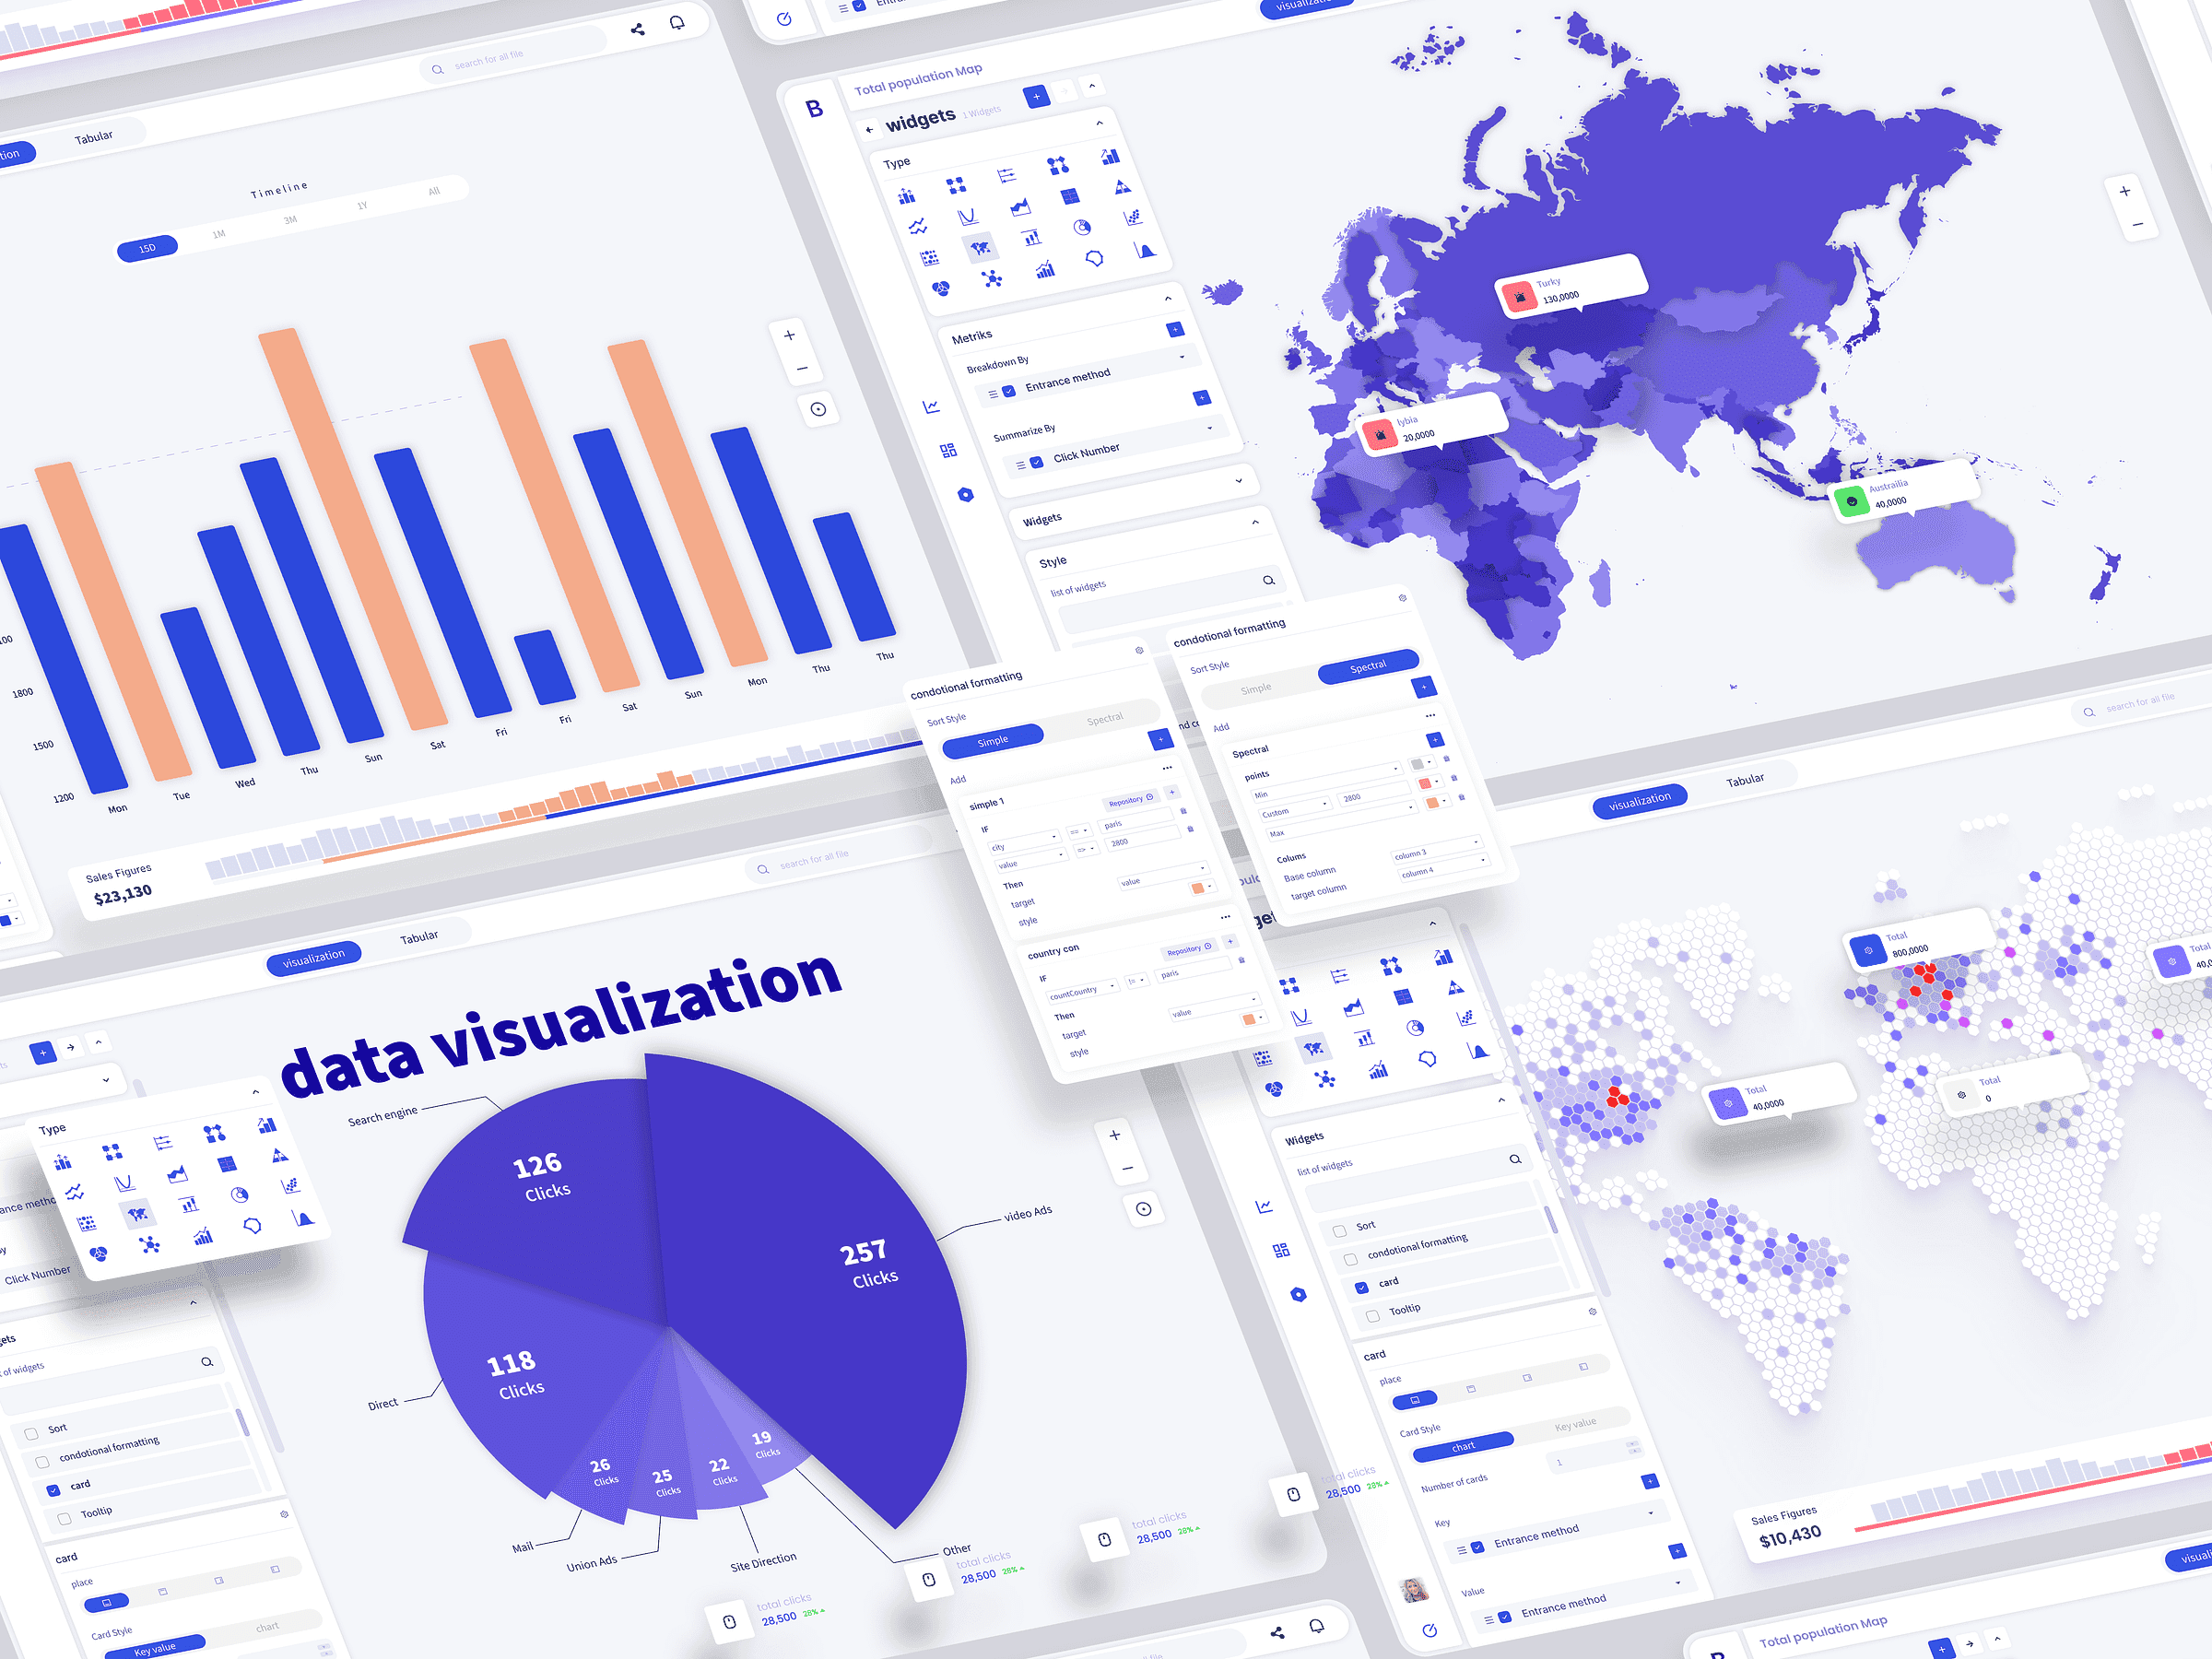
In the world of data analysis and business intelligence, an analytics dashboard plays a pivotal role. It's not just a collection of charts and graphs but a powerful tool that can drive informed decision-making and enhance overall business performance. An analytics dashboard needs to be thoughtfully designed, intuitive, and focused on a singular goal—providing valuable insights to its users.
Design Thinking in Data Visualizations
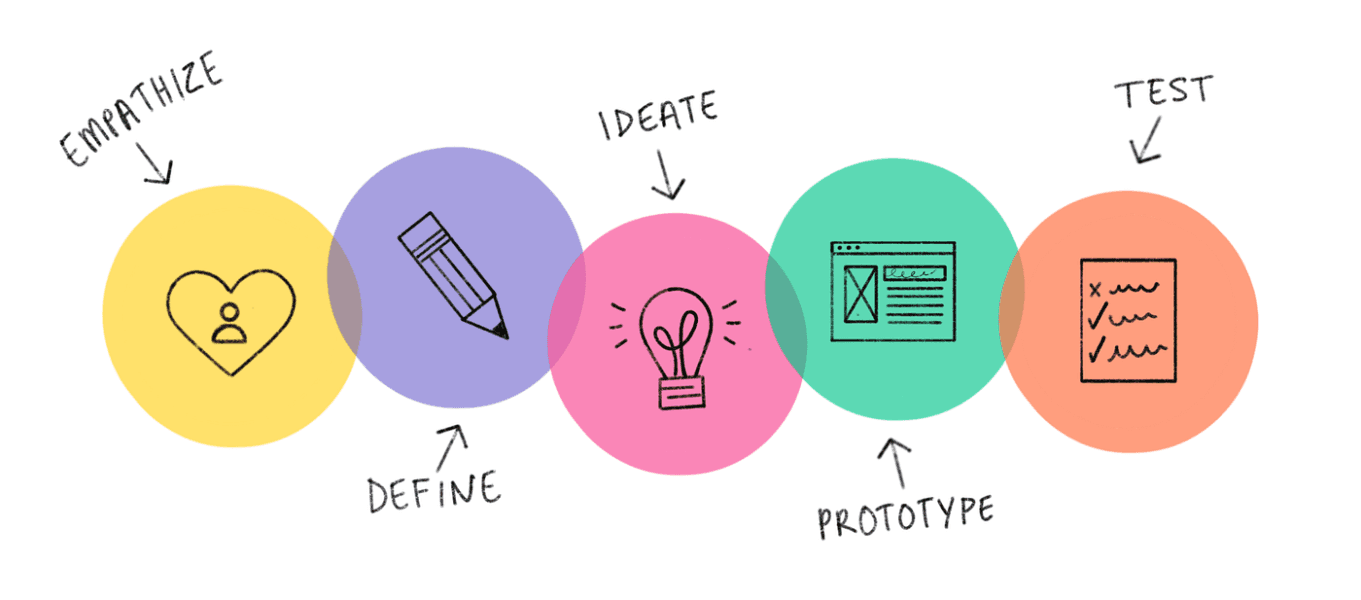
Design thinking principles are not exclusive to product design or marketing; they extend seamlessly into the realm of data visualizations. An effective analytics dashboard is not just a display of raw data; it's a carefully crafted user experience. Applying design thinking involves understanding the needs and expectations of the users, empathizing with their challenges, and iteratively refining the design based on feedback.
A great dashboard doesn't overwhelm users with a barrage of charts. Instead, it guides them through a narrative, helping them connect the dots between data points. It's about adding context and storytelling to visualizations, transforming them from mere representations of numbers into actionable insights.
The Anatomy of a Great Visualization
Ever wondered what makes a data visualization truly powerful?
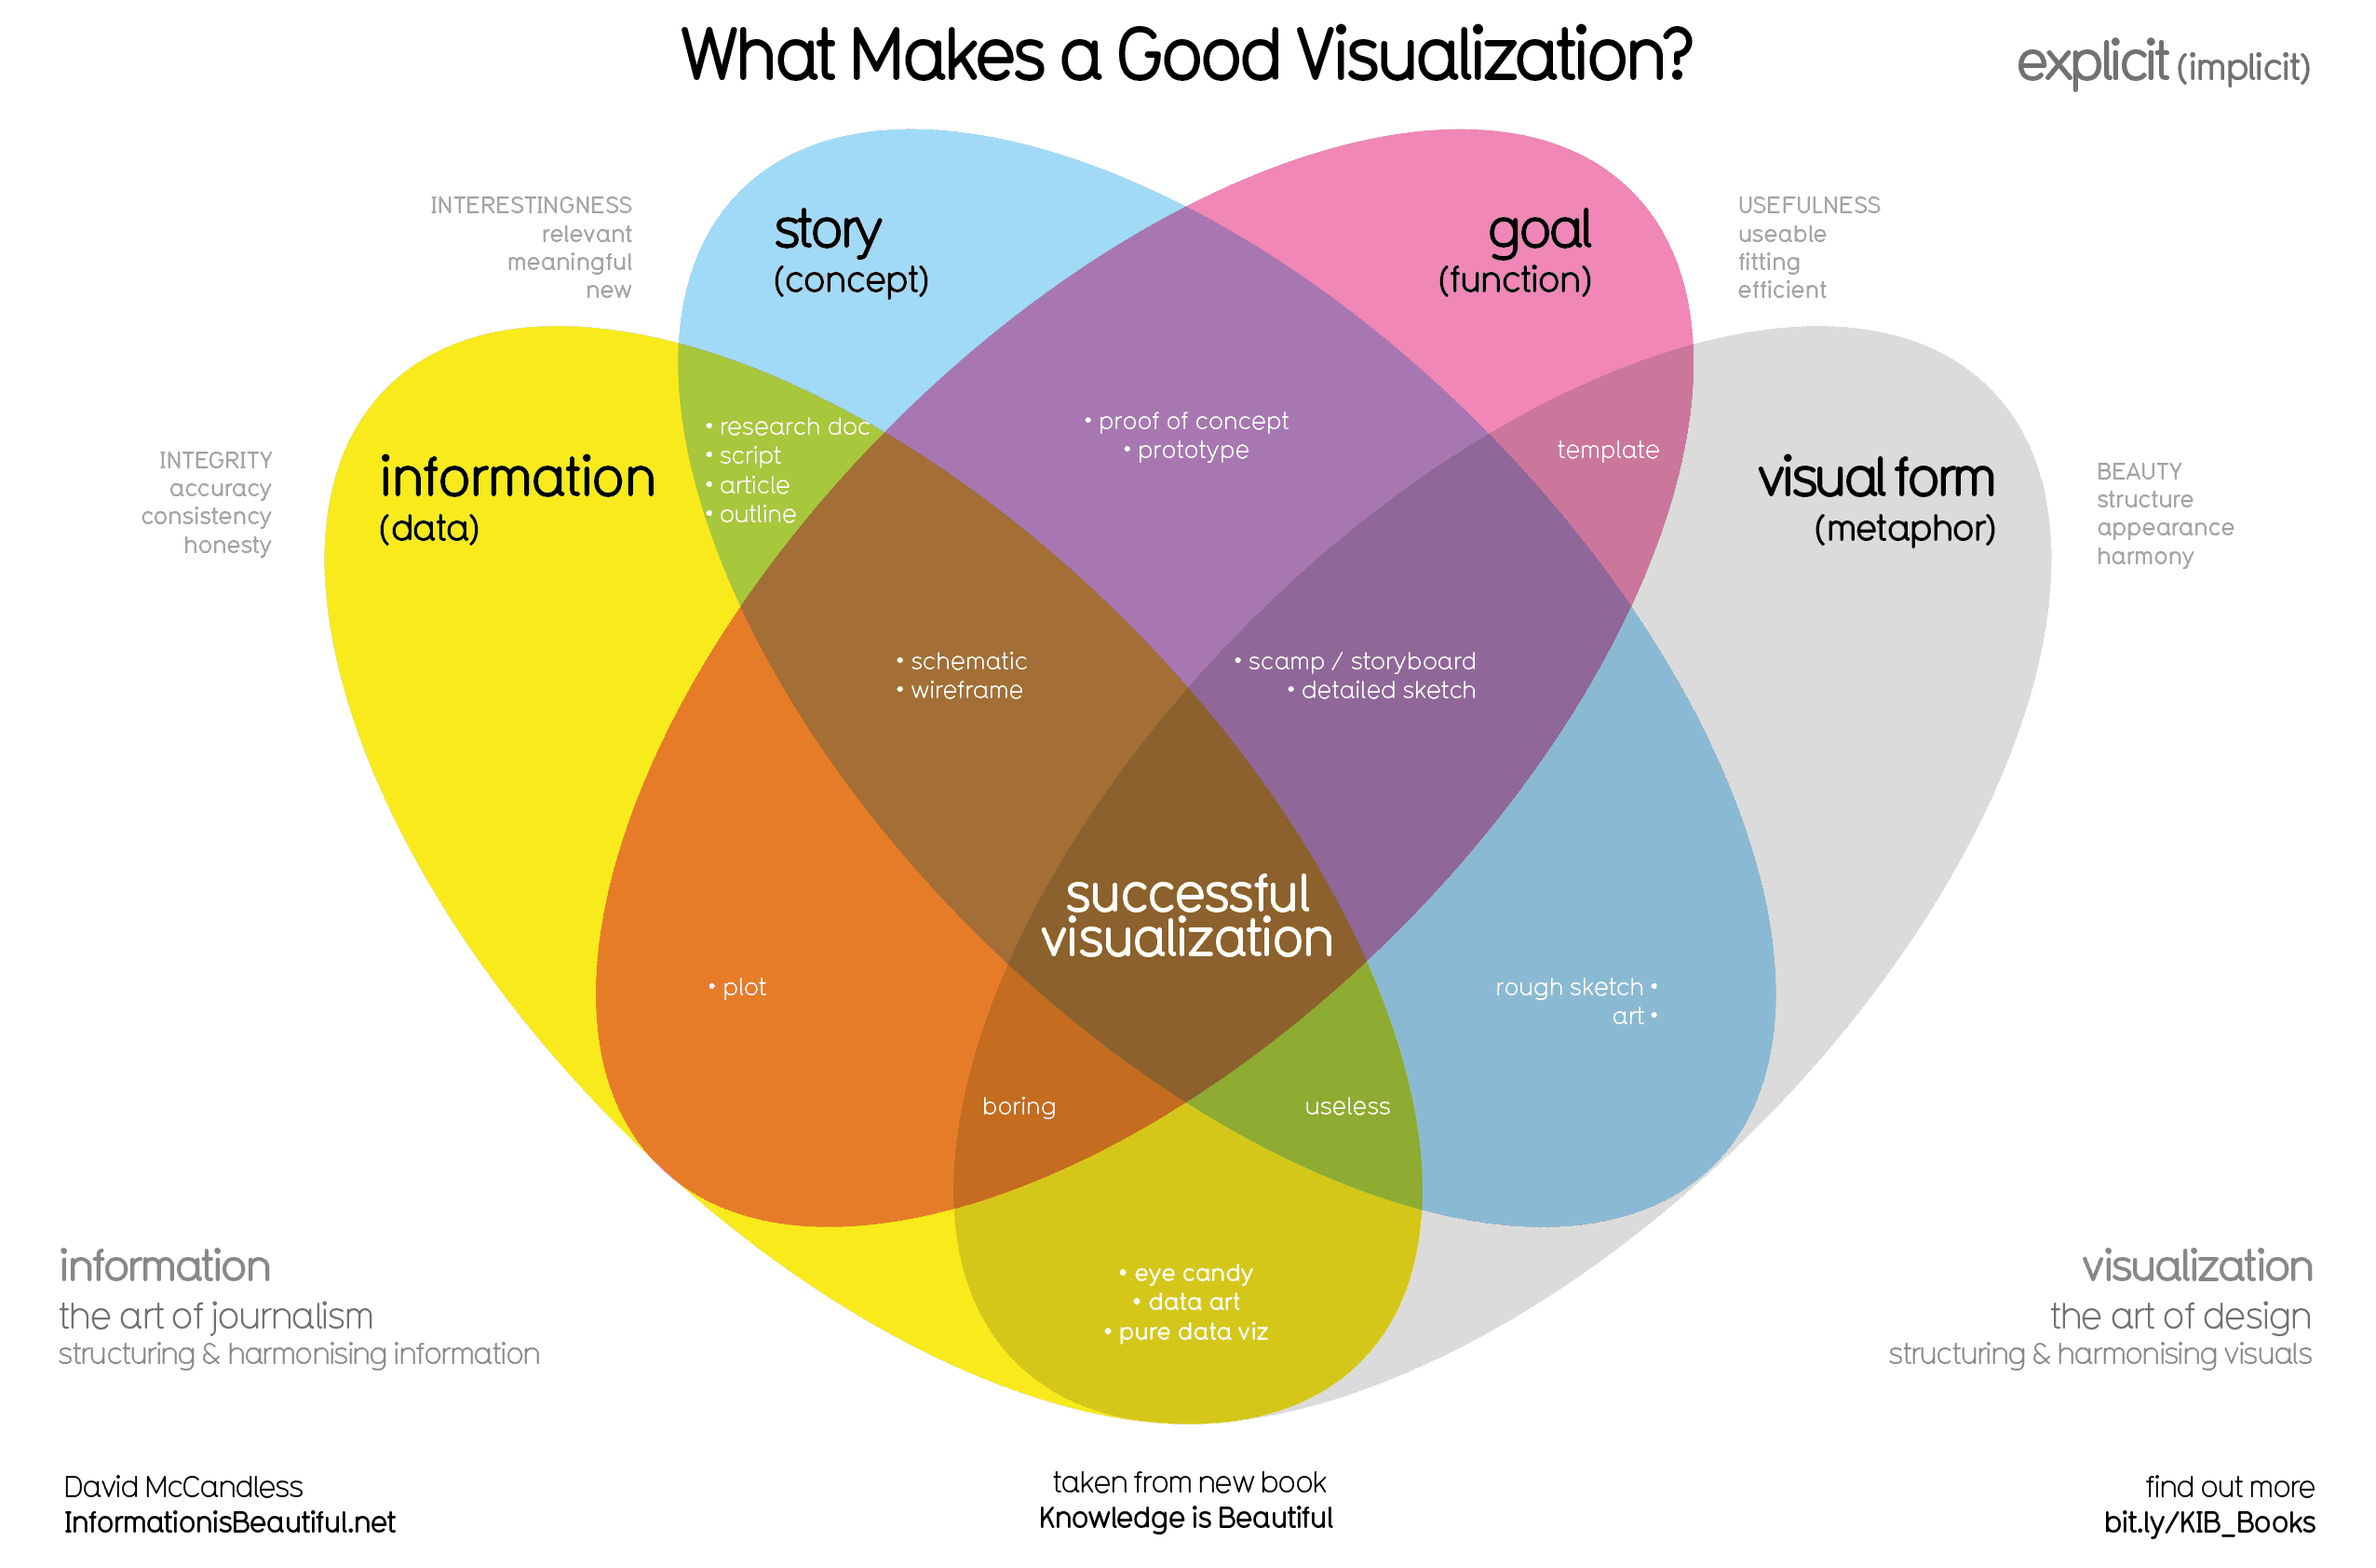
A powerful data visualization comprises four key elements: a goal, the information, a story and a visual form.
A powerful data visualization comprises four key elements: a goal, the information, a story and a visual form.
First, it starts with the goal setting the purpose for the dashboard or report.
Next, the information - the heart of the visualization. This is the core message, the insightful takeaway derived from the data.
Then, we shape the story. This step contextualizes the data, unraveling its relevance and implications, weaving it into a narrative.
Finally, we bring it all together in visual form. Here, the data takes shape in a visually appealing and comprehensible manner, transforming numbers into a meaningful visual experience.
For instance, instead of presenting a bar chart showcasing sales figures, a great visualization could tell the story of sales growth over time, highlight a significant increase or decrease, and visually represent the factors contributing to these trends.
Integrating Chatbots for Interactive Insights
Enhancing the user experience of an analytics dashboard goes beyond dynamic visualizations. Integrating chatbots adds a layer of interactivity, allowing stakeholders and viewers to engage with the data directly. Users can ask questions, seek clarifications, and receive instant insights, making the dashboard a dynamic tool for real-time decision-making.
Chatbots serve as virtual assistants, providing a conversational interface that bridges the gap between complex data sets and non-technical users. This not only democratizes data access but also facilitates a deeper understanding of the insights presented on the dashboard.
Best Practices for Crafting an Exceptional Dashboard
An analytics dashboard should have a singular focus. Define the primary goal of the dashboard—whether it's monitoring sales performance, tracking key performance indicators, or assessing marketing campaign effectiveness.
Keep the design clean and straightforward. Avoid clutter and unnecessary complexity that might distract users from the core insights. Choose a color palette that enhances clarity and ensures that visual elements guide users seamlessly through the narrative.
Remember that the call to action in an analytics dashboard is not a button but an informed decision. Every element of the dashboard should contribute to empowering users to make data-driven choices that positively impact the business.
In conclusion, designing an analytics dashboard that performs great requires a thoughtful blend of design thinking, storytelling, and interactivity. By understanding the needs of users, presenting data with context, and incorporating interactive elements like chatbots, you can create a dashboard that not only informs but empowers decision-makers in your organization.
References:
Have you ever wondered how an analytics dashboard goes beyond being just a collection of charts and graphs?
What if an analytics dashboard could be a powerful tool for informed decision-making rather than just displaying metrics?
In the world of data analysis and business intelligence, an analytics dashboard plays a pivotal role. It's not just a collection of charts and graphs but a powerful tool that can drive informed decision-making and enhance overall business performance. An analytics dashboard needs to be thoughtfully designed, intuitive, and focused on a singular goal—providing valuable insights to its users.
Design Thinking in Data Visualizations
Design thinking principles are not exclusive to product design or marketing; they extend seamlessly into the realm of data visualizations. An effective analytics dashboard is not just a display of raw data; it's a carefully crafted user experience. Applying design thinking involves understanding the needs and expectations of the users, empathizing with their challenges, and iteratively refining the design based on feedback.
A great dashboard doesn't overwhelm users with a barrage of charts. Instead, it guides them through a narrative, helping them connect the dots between data points. It's about adding context and storytelling to visualizations, transforming them from mere representations of numbers into actionable insights.
The Anatomy of a Great Visualization
Ever wondered what makes a data visualization truly powerful?
A powerful data visualization comprises four key elements: a goal, the information, a story and a visual form.
A powerful data visualization comprises four key elements: a goal, the information, a story and a visual form.
First, it starts with the goal setting the purpose for the dashboard or report.
Next, the information - the heart of the visualization. This is the core message, the insightful takeaway derived from the data.
Then, we shape the story. This step contextualizes the data, unraveling its relevance and implications, weaving it into a narrative.
Finally, we bring it all together in visual form. Here, the data takes shape in a visually appealing and comprehensible manner, transforming numbers into a meaningful visual experience.
For instance, instead of presenting a bar chart showcasing sales figures, a great visualization could tell the story of sales growth over time, highlight a significant increase or decrease, and visually represent the factors contributing to these trends.
Integrating Chatbots for Interactive Insights
Enhancing the user experience of an analytics dashboard goes beyond dynamic visualizations. Integrating chatbots adds a layer of interactivity, allowing stakeholders and viewers to engage with the data directly. Users can ask questions, seek clarifications, and receive instant insights, making the dashboard a dynamic tool for real-time decision-making.
Chatbots serve as virtual assistants, providing a conversational interface that bridges the gap between complex data sets and non-technical users. This not only democratizes data access but also facilitates a deeper understanding of the insights presented on the dashboard.
Best Practices for Crafting an Exceptional Dashboard
An analytics dashboard should have a singular focus. Define the primary goal of the dashboard—whether it's monitoring sales performance, tracking key performance indicators, or assessing marketing campaign effectiveness.
Keep the design clean and straightforward. Avoid clutter and unnecessary complexity that might distract users from the core insights. Choose a color palette that enhances clarity and ensures that visual elements guide users seamlessly through the narrative.
Remember that the call to action in an analytics dashboard is not a button but an informed decision. Every element of the dashboard should contribute to empowering users to make data-driven choices that positively impact the business.
In conclusion, designing an analytics dashboard that performs great requires a thoughtful blend of design thinking, storytelling, and interactivity. By understanding the needs of users, presenting data with context, and incorporating interactive elements like chatbots, you can create a dashboard that not only informs but empowers decision-makers in your organization.